Average data center size MW: enterprise vs hyperscale
Compare the average data center size in MW across enterprise, colocation, and hyperscale campuses, and learn why capacity outranks floor space.
In this article6
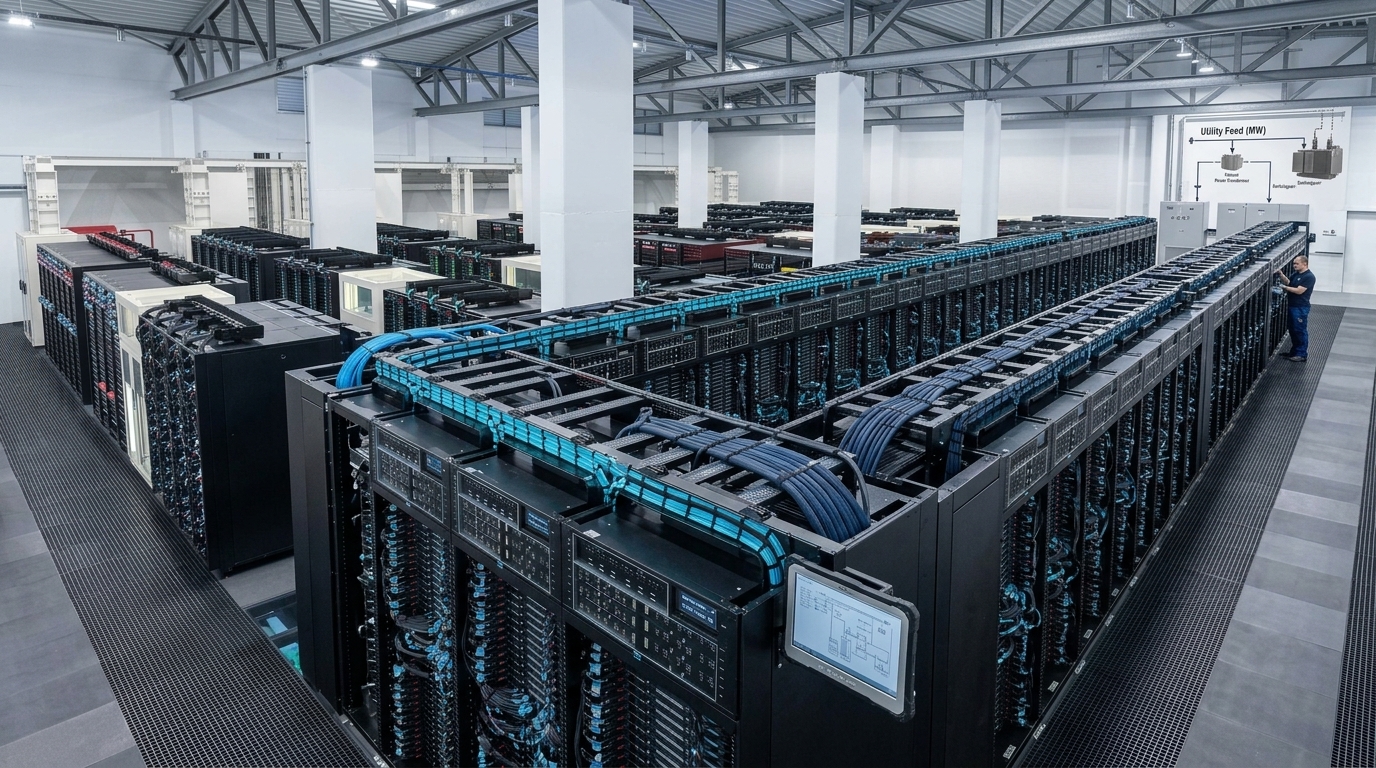
What "size" means for a data centre
Capacity, not floor space, is the primary metric because power is the binding constraint on where facilities can be built. On the measurement question, the Regional Plan Association reported in June 2025 that early data centres used around 2 MW, while the average data centre built today requires around 40 MW, and that construction costs run to roughly $10 million per megawatt, putting a 40 MW facility at a minimum of $400 million.[1] What that spend buys at the small end of the range is covered in the guide to the 1 MW data center cost stack.
- Installed IT load: megawatts usable by compute equipment, the basis for most operator portfolio figures.
- Total facility load: IT load multiplied by PUE, the basis for grid-impact and utility forecasts.
- Contracted capacity: megawatts signed with a utility, which may be years from energisation.
IT load, facility load and contracted capacity
There is no single average size for a data centre, because three different quantities are all measured in megawatts and are routinely confused. The first is installed IT load: the power available to servers, storage and networking equipment. The second is total facility load, which adds cooling, lighting and power conversion losses. The third is contracted capacity: the megawatts a developer has reserved with a grid operator or utility but has not yet energised. The ratio between facility load and IT load is expressed as Power Usage Effectiveness (PUE); the average data centre has a PUE of around 1.8, meaning total facility load is nearly double the IT load.[1]
Published averages by region and vintage
Epoch AI's satellite and permit-based database, updated 23 September 2026, records the current scale of the largest facilities as follows.
| Facility | Owner | Final power (MW) | Date reached or planned |
|---|---|---|---|
| Colossus 1 | xAI | 498 | 7 November 2025 |
| Stargate Abilene | Oracle | 1,180 | 1 July 2026 (planned) |
| Meta Hyperion | Meta | 2,262 | 1 January 2028 (planned) |
The distribution behind any average is wide. Enterprise sites typically sit between 1 and 10 MW of IT load, colocation facilities between roughly 10 and 100 MW, and hyperscale AI campuses from 100 MW to well over 500 MW. Because a small number of very large campuses add enormous megawatts to national totals, a blended average overstates what a typical facility looks like.
Why an average hides the distribution
Two cautions apply when carrying these figures into a plan. First, the largest-campus record has doubled every seven months since Colossus 1 launched in August 2024, so any average computed over a multi-year vintage mixes facility generations that differ by an order of magnitude. Second, the recurring error on this topic is announced capacity counted as live capacity: a figure in a developer's press release is a contract or a plan, not energised load. Sizing a market therefore requires stating the facility tier, the measurement basis and the date, rather than quoting a blended average. These parameters are reflected across major tracking efforts by the Uptime Institute[3], Dell'Oro Group[4], EuroHPC[5], Eurostat[6], the Joint Research Centre[7], and ASHRAE[8], as well as Epoch AI's database[9].
Comparing a site against the right cohort
A capacity figure is defensible only against a cohort of comparable operators. The ten providers below are the set a reader sizing the colocation and hyperscale market would compare. The same caution applies here as above: a portfolio total in contracted megawatts is not the same quantity as a single campus's leased IT load, and the two columns should not be summed. For the European market these operators sit in, the provider-level comparison in Europe's colocation market and the operator overview in colocation data center companies extend this table with pricing and tier criteria.
| Provider | Published capacity figure | Measurement basis as stated |
|---|---|---|
| Aligned Data Centers | 5 GW contracted and available capacity across 50 campuses in the Americas | Contracted and available capacity, portfolio |
| Applied Digital | 210 MW lease signed at Delta Forge 2 | Leased critical IT load, single campus |
| CloudHQ | – | – |
| Colt Data Centre Services | – | – |
| Crusoe Energy Systems | – | – |
| CyrusOne | 1+ GW power capacity; 60+ operational data centers | Power capacity, global portfolio |
| Data4 | 1.5 GW electrical reserve; 10 campuses | Electrical reserve, European land bank |
| Digital Realty Trust | – | – |
| EdgeConneX | – | – |
| Vantage Data Centers | – | – |
A plain hyphen means the provider's own page lists no value for that cell. The practical rule for a board deck follows from the table: quote a figure only with its tier (enterprise, colocation or hyperscale), its basis (installed IT load, facility load or contracted capacity) and its retrieval date, and compare a site only against operators publishing on the same basis.
Sources
Rankings and scores on Optinest cannot be bought — no commercial relationship changes how a provider is assessed. How we score
Related reading
All Datacenters →GPU memory bandwidth sets your token rate
Learn how to calculate GPU memory bandwidth for AI inference and compare specifications across the RTX 4090, RTX 5090, and the NVIDIA H200 data center GPU.

What industries use AI the most
Discover what industries use AI the most based on 2026 official statistics. Compare AI adoption rates across sectors, enterprise sizes, and data publishers.

Three operators hold a third of colocation
Compare the largest global and US colocation data center companies, evaluation criteria, and why AI workloads are shifting to managed GPU clusters.
