How to explain PUE: what power usage effectiveness means
A complete guide on how to explain PUE and evaluate datacenter energy efficiency. Compare industry averages against regulatory targets and grid constraints.
In this article7
Power Usage Effectiveness (PUE) formula and calculation
Power Usage Effectiveness (PUE) is the standard metric used across digital infrastructure to assess the operational energy efficiency of a datacenter facility. Defined as the ratio of total facility power to the power consumed strictly by IT equipment, PUE quantifies how much non-compute overhead is required to support active workloads. In mathematical terms, the formula is expressed as PUE = Total Facility Energy / IT Equipment Energy. A theoretical ideal PUE is 1.0, which indicates that all incoming electricity directly powers compute, storage, and networking hardware, with zero energy diverted to facility support systems. PUE is a ratio, not a percentage: it starts at 1.0 and climbs as overhead grows, and it cannot be turned into an efficiency score by subtracting it from one. Under ISO/IEC 30134-2 both terms of the ratio are annual energy totals in kilowatt-hours, not instantaneous power readings.
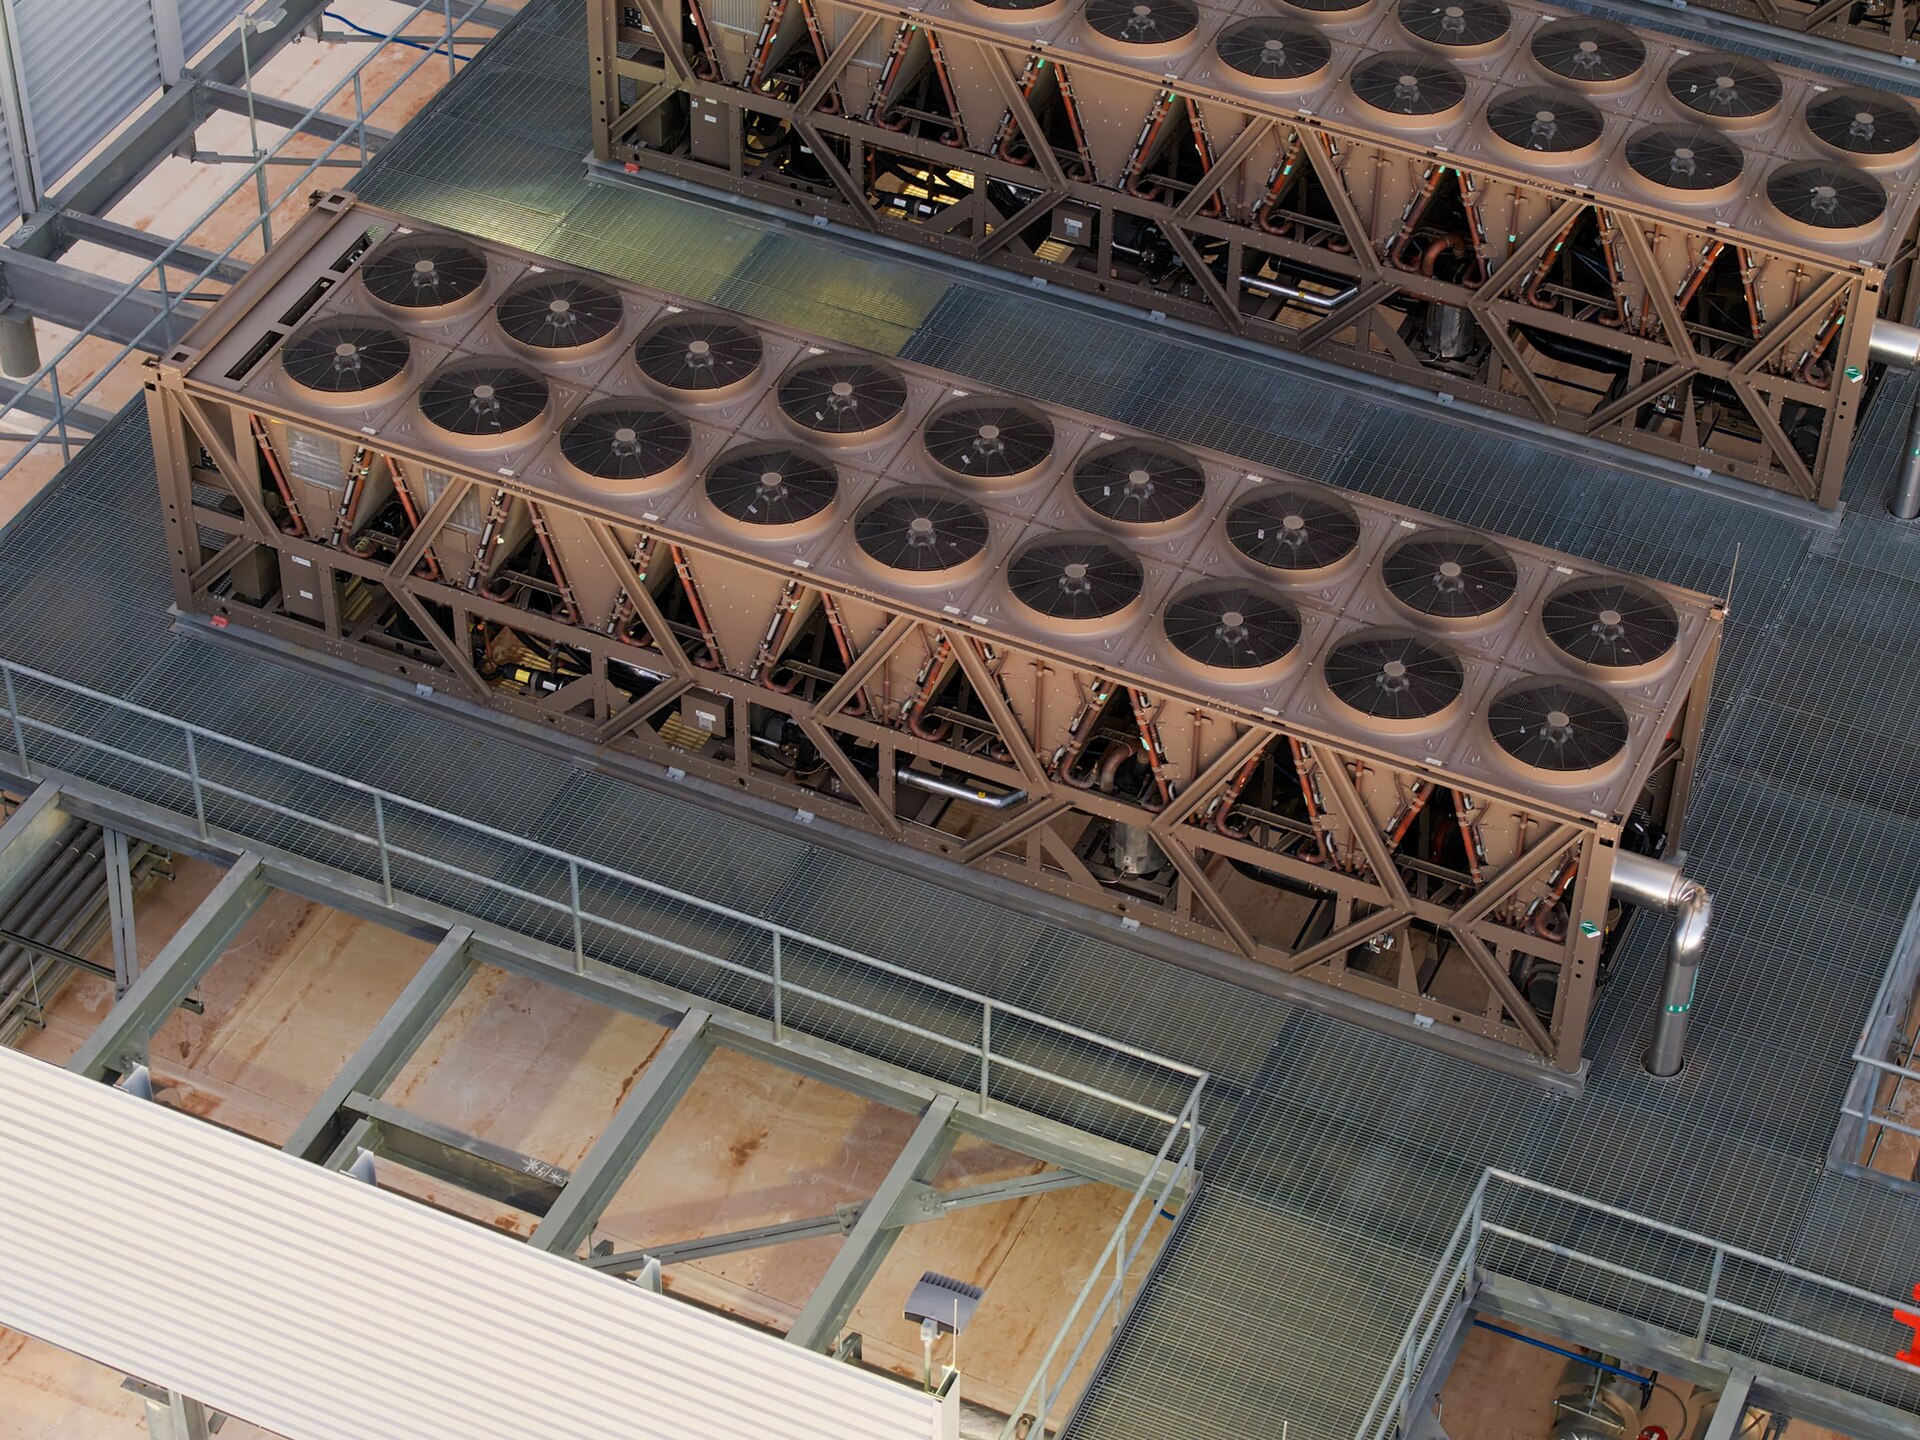
In real-world operations, total facility energy includes the primary power consumed by servers plus all ancillary loads: chiller plants, cooling towers, computer room air handlers (CRAHs), direct-to-chip coolant pumps, uninterruptible power supply (UPS) conversion losses, switchgear, and site lighting. A facility operating at a PUE of 1.5 consumes 1.5 kilowatt-hours (kWh) of total electricity for every 1.0 kWh delivered to its server racks. The remaining 0.5 kWh represents thermal management and electrical distribution overhead. For enterprise buyers evaluating colocation contracts, this multiplier directly influences operating expenditure and datacenter energy allocation.
Understanding this overhead ratio is essential given the aggregate scale of modern computing demand. According to the International Energy Agency (IEA), data centres accounted for around 1.5% of the world's electricity consumption in 2024, or 415 terawatt-hours (TWh)[1]. When applied across hundreds of terawatt-hours, marginal reductions in facility PUE translate to gigawatt-scale differences in grid capacity requirements.
| PUE Ratio | Facility Energy Overhead per 1 kW IT | Share of Total Energy Reaching IT (1 / PUE) | Primary Operational Profile |
|---|---|---|---|
| 1.00 | 0.00 kW (0%) | 100.0% (Theoretical maximum) | No facility losses; physically impossible in ambient environments |
| 1.15 | 0.15 kW (15%) | 87.0% | Hyperscale build with direct liquid cooling and free-air economization |
| 1.30 | 0.30 kW (30%) | 76.9% | Modern enterprise facility with hot/cold aisle containment and high-efficiency chillers |
| 1.50 | 0.50 kW (50%) | 66.7% | Standard legacy enterprise or mixed-tenant colocation facility |
| 1.80 | 0.80 kW (80%) | 55.6% | Uncontained legacy datacenter with continuous mechanical refrigeration |
Calculating PUE accurately requires defining the measurement boundary according to international standards such as ISO/IEC 30134-2. While momentary PUE fluctuates based on seasonal ambient temperatures and compute utilization rates, verified benchmarking relies on annualized PUE, which averages 12 consecutive months of energy readings. That standard also defines three measurement categories that differ in where IT energy is metered: at the UPS output (PUE1), at the power distribution unit output (PUE2), or at the input to the IT equipment itself (PUE3). Total facility energy is measured at the utility service entrance in every case. Because each step closer to the hardware leaves more distribution loss on the facility side of the ratio, the same hall reports a higher number as PUE3 than as PUE1, so two vendor figures are only comparable at the same category.
Industry average PUE and efficiency benchmarks
Tracking global facility performance reveals a structural divide between older enterprise installations and modern hyperscale deployments. In its annual survey of global infrastructure operators, the Uptime Institute documented an overall industry average PUE of 1.58 in 2023[2]. That figure has since been superseded. In the 2025 edition of the same survey, respondents' annual PUE had a weighted average of 1.54, the sixth consecutive year the headline has virtually stood still.[3] Both are per-respondent averages across varied facility tiers, ages, and regional climates.
When normalized by total deployed IT load, larger facilities demonstrate a distinct efficiency advantage. The capacity-weighted PUE across global facilities measured 1.47 in 2023[2]. This lower figure occurs because high-capacity campuses (often exceeding 20 MW to 100 MW) deploy optimized airflow containment, localized variable-speed fan arrays, and high-efficiency transformer configurations that are uneconomical to retrofit into legacy buildings. The 2025 survey shows the same pattern in current data: facilities of 20 MW and above averaged a PUE of 1.44 globally, and facilities commissioned since around early 2020 averaged 1.48.[3]
Despite rapid modernization among Tier 1 providers, the broad industry average has remained relatively flat between 1.55 and 1.59 since 2020.[2] This stagnation is caused by two structural factors:
- Legacy facility drag: Thousands of enterprise-owned on-premises server rooms and older colocation sites operate with PUE values between 1.6 and 2.0, offsetting efficiency gains made by new campuses.
- Thermal limits of air cooling: Standard air handling approaches diminishing thermodynamic returns when rack power densities exceed 15 kW to 30 kW, keeping auxiliary fan and chiller power high unless architectures transition to liquid systems.
For procurement teams selecting infrastructure providers, evaluating whether a vendor cites an unweighted site average or a verified, annualized capacity-weighted PUE prevents misleading comparisons between greenfield facilities and legacy halls.
Regulatory thresholds for high-efficiency operations
Efficiency thresholds are transitioning from voluntary corporate reporting metrics into binding statutory mandates. European jurisdictions are introducing concrete operational ceilings that compel datacenter operators to reduce auxiliary energy consumption or face financial penalties and permitting restrictions.
A primary example is the German Energy Efficiency Act (Energieeffizienzgesetz - EnEfG), which established mandatory PUE ceilings for operating facilities. Under Section 11 of the statute, datacenters that started operating before 1 July 2026 must permanently achieve an annual average PUE of 1.5 or lower from 1 July 2027, tightening to 1.3 or lower from 1 July 2030[4]. Datacenters commencing operations from 1 July 2026 are required to meet a PUE of 1.2 or lower, to be reached on an annual average basis within two years of commissioning[4].
How low a site can push its PUE depends more on climate and heat-rejection design than on any single cooling technology: Uptime's 2025 survey found 15% of respondents already reporting a PUE of 1.3 or better, concentrated in high-latitude facilities in North America and Europe[3], while in hotter regions the most efficient heat-rejection systems remain untenable. Where rack densities rule out air cooling entirely, the route to a low ratio runs through liquid. Operators deploy direct-to-chip or immersion liquid cooling systems to transfer heat directly from high-TDP processors to closed water loops, enabling year-round dry-cooler economization.
- Design verification: Auditing the mechanical engineering baseline to ensure cooling and distribution overhead stays within the statutory ratio across peak summer wet-bulb temperatures.
- Waste heat integration: Establishing thermal export infrastructure to supply district heating networks or industrial processes as mandated by local efficiency laws.
- Statutory disclosure: Aligning power telemetry with CSRD reporting obligations to ensure facility PUE calculations are auditable by independent statutory verifiers.
When choosing an infrastructure provider for long-term deployments, prospective tenants must confirm that the facility roadmap accounts for these regulatory milestones. Selecting a site that cannot reach a 1.3 PUE by statutory deadlines introduces legal non-compliance and lease renewal risks.
What PUE does not measure
PUE is a boundary metric: it compares total facility energy to IT energy and says nothing about where that electricity comes from, how carbon-intensive it is, or how much water the cooling plant consumes. Two facilities can report an identical 1.15 PUE while running on completely different energy mixes. When comparing named providers, treat PUE as one published criterion among several rather than a single sustainability score, and ask for the measurement boundary and reporting period behind every quoted value.
PUE is also silent on the grid side of the equation. A ratio of 1.2 tells a tenant nothing about whether the local network can deliver the requested connection capacity, or when it could be energised. That question is answered by the transmission system operators, who publish the procedure for connecting large consumers such as datacenters to the extra-high-voltage network: Germany's four TSOs now assess connection applications against a set of verifiable project-maturity criteria instead of processing them in order of arrival[5]. The procedure is joint across 50Hertz, Amprion, TenneT Germany and TransnetBW[6] and applies from 1 April 2026, so the same maturity test applies whichever control area a site sits in. A shortlist comparison should read facility efficiency and grid availability as two separate criteria.
Enterprise teams conducting datacenter site selection should therefore ask each shortlisted provider for the same three things: the annualized PUE, the measurement boundary used, and the 12-month period it covers. Without those, quoted ratios cannot be compared across vendors.
How to verify a provider's PUE claims
When evaluating future-proof infrastructure providers, decision-makers should follow a structured verification process:
- Request annualized PUE audit certificates: Demand 12-month trailing PUE data verified under ISO/IEC 30134-2 standards rather than unverified design claims.
- Check whether the figure is capacity-weighted: A single best-performing hall is not representative of a multi-site estate, so ask whether the quoted ratio is a site average or weighted by deployed IT load.
- Confirm the measurement category: Ask which ISO/IEC 30134-2 category the figure is reported at (PUE1, PUE2 or PUE3), because the same hall scores higher at PUE3 than at PUE1, and check that generator, UPS and office loads are treated consistently across the vendors you compare.
- Review thermal compliance roadmaps: Ensure the facility architecture supports liquid cooling loops and heat reuse integrations required by statutory efficiency laws, with dated milestones against the 2027 and 2030 thresholds.
By reading PUE as a defined, auditable ratio rather than a marketing number, and by insisting on the same boundary and reporting period from every shortlisted vendor, procurement teams can compare facilities on published criteria and check them against the statutory ceilings coming into force this decade.
Frequently asked questions
What does a PUE of 1.5 mean?
A Power Usage Effectiveness (PUE) of 1.5 means the total facility uses 1.5 watts of power for every 1 watt delivered to the IT equipment. The additional 0.5 watts are consumed by cooling, lighting, and power distribution systems.
What is considered a good PUE?
A good PUE typically falls below 1.4. While the global industry average was 1.54 in Uptime Institute's 2025 survey, larger facilities do better: sites of 20 MW and above averaged 1.44, and 15% of respondents reported 1.3 or better.
Is 1.4 PUE good?
Yes, a PUE of 1.4 is efficient and sits below the 2025 industry average of 1.54. Reaching a 1.4 PUE indicates that a datacenter has optimized its facility infrastructure, meaning only 0.4 watts of overhead power are used for every 1 watt of actual compute load.
What does a low PUE value indicate?
A lower PUE value indicates higher energy efficiency. It means a larger proportion of the electricity drawn from the grid is directly powering the servers and networking equipment, with less energy lost to cooling, lighting, and internal power distribution.
What does PUE not tell you?
PUE compares total facility energy to IT energy, so it says nothing about the carbon intensity of the electricity supplied, water consumption, or how efficiently the servers themselves convert power into useful work. Two sites can report the same PUE on very different energy mixes.
Sources
- Executive summary – Energy and AI – Analysis - IEA iea.org
- Large data centers are mostly more efficient, analysis confirms journal.uptimeinstitute.com
- datacenter.uptimeinstitute.com
- § 11 EnEfG - Einzelnorm gesetze-im-internet.de
- Letztverbrauchende Kunden amprion.net
- 50hertz.com > Vertragspartner > Netzkunden > Netzanschluss 50hertz.com
Rankings and scores on Optinest cannot be bought — no commercial relationship changes how a provider is assessed. How we score
Related reading
All Energy →Colocation is really two different purchases
Compare wholesale and retail colocation models. Evaluate pricing, capacity limits, grid constraints, and managed GPU alternatives for infrastructure.

Low Latency AI: European Datacenter and Market Constraints
Analyze the power constraints reshaping Europe's AI datacenter market. Learn how grid queues and the FLAP-D latency premium impact inference deployments.

Liquid cooling vs air: Rack density and energy overhead
Compare air, direct-to-chip and immersion cooling for data centers. Learn how rack power density, PUE and operational complexity determine the right choice.
